|
|
|
|
|
|
|
|
|
|
|
|
|
 |
|
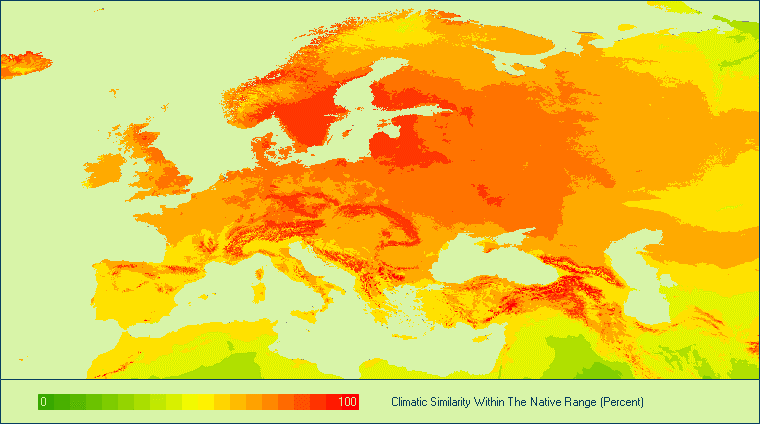
Version (B) outside / within quantile* (0 / 1 - 2) - all climate raster have been compared with home range - raster, that values lie between minimum-maximum** of the determined span, have been assessed with 1 or 2 - raster, that values lie in the span of outer quantiles* have been assessed with 1 - raster, that values lie in the span of inner quantiles* have been assessed with 2 - raster, that values lie outside the minimum-maximum** have been assessed with 0 - the maximum number of agreements is dependent from the number of used (montly) variables - (the example shows: 48 variables = maximum hits of 96 = 100%) * [instead of quantiles variable percentiles may be used] **[the minimum-maximum-span may be defined by freely scalable percentiles] (
|
|
|
|
|
|
© 2006 updated 08.02.2011 |